

The lowest upfront construction cost can become the more expensive choice over a building’s useful life. A lifecycle cost analysis for construction projects compares the costs of acquiring, operating, maintaining and eventually disposing of a building system over a defined period. It weighs the initial investment against energy use, repairs, replacements and durability.
It’s reasonable to focus on the construction budget: that figure is visible, immediate and tied to project approval. But it doesn’t show what a design will require from owners and operators over time. A life-cycle comparison brings those costs into the decision before materials and systems are fixed.
This article explains what the analysis includes, how upfront costs compare with energy and operating costs, and how material durability affects the calculation. You’ll also see how teams compare designs over a facility’s useful life and revisit assumptions as the design develops. The goal is a sound basis for choosing, not a promise that one option will always cost less.
Key Takeaways
- Compare acquisition, energy, operating, maintenance, replacement and disposal costs across a defined period, not just the initial construction budget.
- Assess how a design’s energy demand and operating needs affect its total cost of ownership over time.
- Include durability and maintenance requirements when comparing materials such as flooring, façades, finishes, doors and windows.
- Evaluate alternative designs using consistent assumptions about useful life, replacement timing and future costs.
- Revisit the analysis as the design develops so cost comparisons reflect the project’s current scope and decisions.
What is a Life-Cycle Cost Analysis on a Building Project?
A lifecycle cost analysis for construction projects compares a building choice’s costs over a defined period. It helps Canadian project teams evaluate long-term obligations alongside the initial budget.
Life-Cycle Cost Analysis Definition and Purpose
Life-cycle cost analysis assesses the costs of acquiring, owning, maintaining and disposing of a building system over its lifetime. It shows how costs arise at different stages, rather than treating the purchase price as the full financial picture. For example, an option with higher acquisition costs may require less maintenance. Comparing these trade-offs helps teams make informed decisions before committing to a design.
Building-System Life-Cycle Cost Analysis
For building systems, the analysis examines energy use, operating demands, maintenance, replacement and disposal. The National Institute of Standards and Technology’s Building Life Cycle Cost program includes Handbook 135 as a resource. ASTM International identifies standard E917- 02 as an industry procedure for analysing building life-cycle costs. Teams may compare HVAC, lighting, thermal envelopes, photovoltaic generation and domestic hot water systems.
For lifecycle cost analysis for construction projects, define the system boundary first. A comparison of heating options, for instance, should include the equipment and related controls, not just the central unit. A consistent scope helps teams interpret differences in cost and maintenance.
Life-Cycle Cost Analysis in Value Engineering
In value engineering, cycle cost analysis tests whether a proposed change preserves function while improving long-term value. A lower initial cost alone does not establish a better choice. Compare alternatives using the same period, scope and cost categories, then assess maintenance and replacement implications. For Canadian projects, identify the owner’s evaluation criteria, funding terms and procurement documents before setting the method.
To conduct the analysis, define the scope and period, list design alternatives, estimate each option’s costs by timing, then compare discounted totals. The project team can coordinate input from the architect, energy consultant, and mechanical and electrical engineers. Document assumptions alongside the results.
Use the discount rate and inflation treatment required by the owner’s evaluation framework. Pair nominal costs with a nominal rate, or inflation-adjusted costs with a real rate. Set the analysis period to reflect the decision and the relevant system life.
Uncertainty can arise from future energy prices, maintenance needs, replacement timing and end-of-life value. Sensitivity analysis shows how discounted net present value changes when assumptions, including the discount rate, vary.
For software and data, teams can use cash-flow spreadsheets or life-cycle cost analysis tools, supported by project estimates, supplier information, utility records and maintenance histories. A lifecycle cost analysis for construction projects is only as useful as its traceable inputs, so document each source and assumption.
Upfront costs versus operating and energy costs
The initial construction budget captures only one point in a building’s cost profile. Comparing it with future energy, operating and maintenance demands shows what ownership requires over the analysis period.
Upfront and Acquisition Costs
Upfront and acquisition costs cover the resources needed to procure and construct a building or system. They can include design, materials, equipment, installation and commissioning. These costs determine the immediate funding requirement, but don’t show what the asset will need after handover. For example, two HVAC options may meet the same design need but differ in equipment price, installation effort and future service requirements. Record costs against the same scope to make the comparison meaningful.
Operating, Energy, and Maintenance Costs
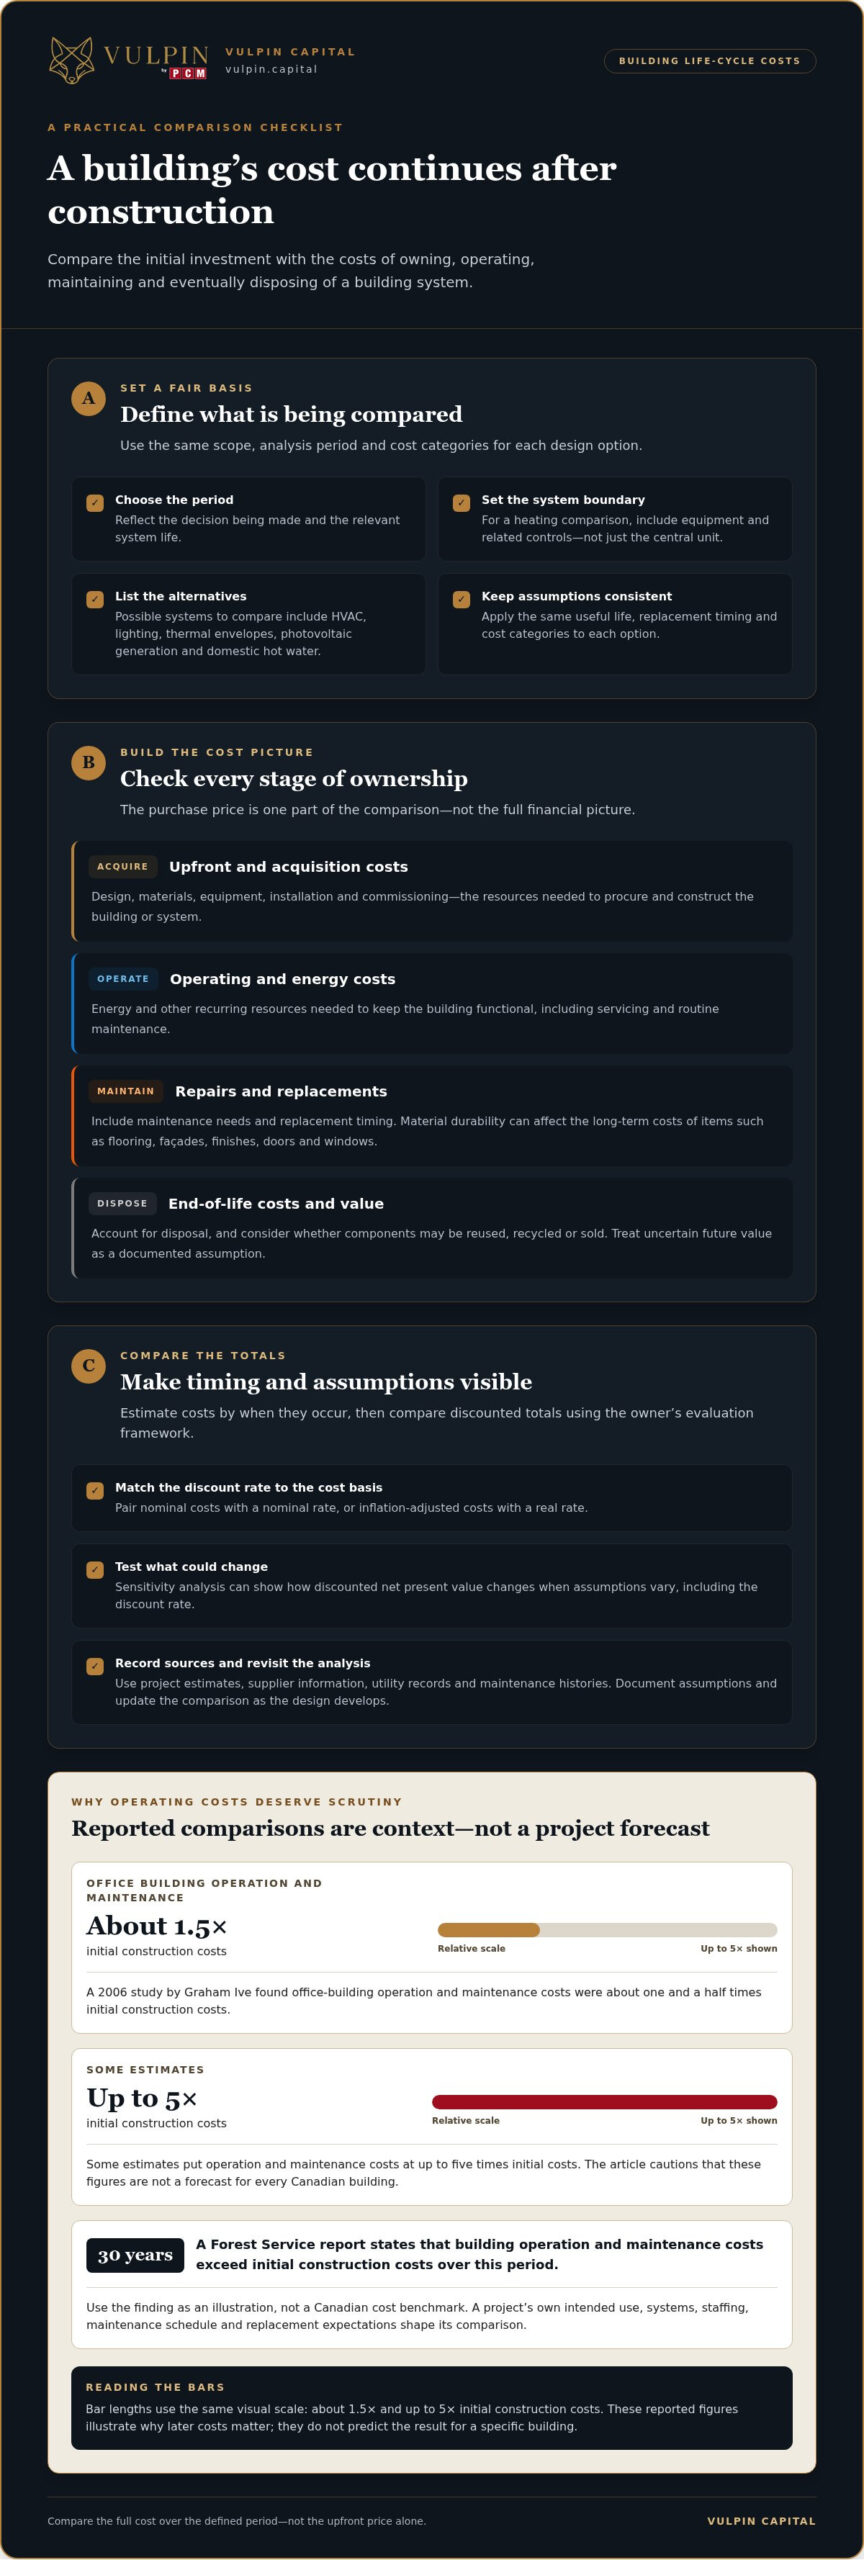
Operating costs include the recurring resources needed to keep a building functional, including energy, servicing and routine maintenance. They belong in the analysis because a smaller initial cost can shift expenditure into later years. A 2006 study by Graham Ive found office-building operation and maintenance costs were about one and a half times initial construction costs. Some estimates put those costs at up to five times initial costs. These figures are not a forecast for every Canadian building; they show why operating assumptions deserve scrutiny.
The Forest Service report states that building operation and maintenance costs exceed initial construction costs over a 30-year period. Use that finding as an illustration, not a Canadian cost benchmark. For a project’s own comparison, examine the building’s intended use, energy-consuming systems, staffing needs, maintenance schedule and replacement expectations. These inputs determine whether a design’s lower initial cost remains economical during operation.
Disposal Costs and Long-Term Value
Disposal costs cover the work and resources required when a system or asset reaches the end of its useful life. A complete comparison also considers whether components can be reused, recycled or sold, since end-of-life value changes the net cost. Future market value is uncertain. Treat it as an assumption, document its basis and apply the same method to each option.
A higher initial cost can make sense if it reduces energy demand, maintenance or replacement needs. The decision depends on the combined cost over the analysis period, not the purchase price alone. Compare alternatives using consistent assumptions, then identify which recurring costs drive the difference. This makes the trade-off clear instead of hiding it in a headline figure.
Schedule affects the comparison too. Delayed completion can postpone occupancy or operations while extending temporary facilities, site supervision or other project resources. These effects depend on the project’s intended use and critical path. Include schedule-related costs when they can be linked to a specific delay or decision. Otherwise, they may distort the comparison.
To keep the accounting disciplined, separate one-time costs from recurring costs and record when each occurs. Then distinguish cost reductions from costs shifted to another phase or budget. This matters in value engineering: removing an initial specification may reduce construction expenditure but increase cleaning, repair or replacement demands. Project teams examining how costs interact with delivery can also review project execution planning.
Building-material durability and maintenance
For Canadian building types, lifecycle cost per square metre compares the costs assigned to each square metre over a defined analysis period. The result depends on building use, material selection, exposure, maintenance needs and replacement timing, so a benchmark only helps when those conditions are comparable.
A design team can compare flooring, façades, finishes, hardware, doors and windows. Each material has a purchase cost and a maintenance profile. For example, a finish that needs frequent repainting brings recurring labour and material demands, while a more durable option may reduce those interventions. The right investment is the one suited to the building’s intended use, not necessarily the option with the highest durability rating.
Maintenance estimates should reflect actual tasks, not one allowance applied to every option. Separate routine cleaning from inspection, repair and planned replacement. A flooring comparison, for instance, should account for cleaning, damage repair and disruption from replacing sections. A façade assessment should consider access requirements and the work needed to maintain its protective function.
Operations and maintenance benchmarking helps test whether an estimate reflects the building’s use. Compare records from buildings with similar occupancy, operating schedules, materials and maintenance standards. Keep the benchmark’s scope consistent: a figure that includes utilities cannot be compared directly with one covering repairs alone. Normalizing results per square metre can help, but the comparison period and included tasks must also match.
For Canadian projects, account for the conditions materials will face at the site. A building entrance exposed to regular foot traffic may need a different flooring specification from a lightly used interior room. A façade’s exposure and access arrangements also affect inspection and repair planning. These examples show why a material schedule should connect each selection to its expected maintenance work.
Durability alone does not determine value. A long-lasting material can still increase ownership costs if it requires specialized maintenance or difficult access. Conversely, an accessible component with straightforward repair procedures can be easier to manage, even if it needs more frequent attention. Record each alternative’s assumed service life, maintenance frequency and replacement scope, then compare them over the same analysis period.
Use a consistent benchmarking process:
- Group materials by function, such as flooring, façade or door hardware.
- Record expected inspection, cleaning, repair and replacement tasks for each option.
- Compare similar buildings and maintenance scopes, then normalize results per square metre.
- Test how the result changes when service life or maintenance frequency changes.
This structure makes the maintenance burden visible before specifications are fixed. It also gives facilities teams a practical record for planning future work, rather than leaving material choices disconnected from operating practice.
Comparing alternative designs over a facility’s useful life
Life-cycle cost analysis compares design alternatives over the same analysis period. The aim is to identify lower long-term costs and stronger value, not simply the lowest initial price. Each option needs a consistent scope, cost categories and timing assumptions. Otherwise, the comparison may favour an alternative because its future obligations were counted differently.
The higher-priced item lasts longer, changing how often replacement costs enter the calculation. Compare both options over the facility’s analysis period, including replacement timing and associated work. Keep assumptions consistent, and don’t treat the purchase price as the only relevant cost.
The analysis period is a key factor. Select it to suit the facility or system decision, then apply it to every alternative. A longer horizon can capture additional maintenance and replacement events, while a shorter one may exclude costs that occur later. Document the period because changing it can alter which option appears less costly.
Organize each alternative’s costs by when they occur. Include acquisition, energy, operation, maintenance, replacements and disposal. Discount future cash flows to a common present-value basis, using the same rate and assumptions for every option. If one design receives a more favourable calculation method, the comparison is not even. Show the timing and basis of each major cost.
Replacement timing can materially affect the calculation. For a 20-year analysis period, a replacement system with a 15-year life may have one-third of its full replacement cost included. This illustrates why teams must account for how much useful life remains at the end of the analysis period. Apply the same method to comparable systems and explain the treatment in the project record.
Future market prices at the end of an item’s useful life cannot be predicted with 100% accuracy. Record uncertain values as assumptions, then test how changes affect the result. Sensitivity analysis can show whether an alternative remains preferable when energy, maintenance or replacement inputs change. If the ranking shifts sharply, identify which assumption drives that change before relying on the comparison.
For a Canadian building project, the team can compare alternatives such as different envelope assemblies or HVAC systems. Keep the building use, performance requirements and analysis period consistent. Then review the present-value results alongside maintenance demands and replacement timing. This approach produces a decision grounded in the project’s own scope, rather than an unrelated infrastructure example or a headline cost alone.
Revisiting LCCA throughout design and construction
Construction project teams should integrate life-cycle cost analysis early and revisit it as the design develops. Each revision can change quantities, system performance, installation requirements or maintenance access. A cost model based on earlier drawings may no longer represent the project. Treat each update as a controlled decision, not a one-time calculation.
At concept design, record the alternatives and assumptions that determine the comparison. As the architect develops layouts, update areas, material selections and system loads. When mechanical and electrical engineers refine equipment, revise energy use, replacement timing and service requirements. There’s no need to recalculate every line after every sketch. Update inputs affected by a design decision, and preserve the previous version for comparison.
Use a change log to connect each design revision to its financial effect. For example, if a project replaces a central plant with distributed equipment, note changes to equipment scope, space needs, controls and maintenance access. Then identify which operating and replacement assumptions must change. A clear record helps the team distinguish a genuine cost improvement from a cost transferred to another system or project phase.
During design development, align the estimate with current drawings and specifications. Confirm that quantities, performance requirements and included work describe the same alternative. If one option includes controls or commissioning and another omits them, the comparison is incomplete. Resolve scope differences among the architect, estimator and engineering team before using the updated result to select an option.
Construction brings another set of inputs. Substitutions, approved changes and installation constraints can alter the basis of the analysis. Record the selected product and its maintenance requirements when a specification changes. If a substitution changes expected service life or energy performance, update the relevant assumptions. Keep the design estimate separate from committed and actual project costs so each figure has a clear purpose.
A practical review can follow these checkpoints:
- At concept design, define alternatives, scope and operating assumptions.
- At design development, revise quantities, system choices and maintenance access.
- Before procurement, compare specified products and approved substitutions.
- During construction, record changes that affect operating or replacement costs.
- At handover, preserve the final assumptions for facilities planning.
At each checkpoint, name the decision owner, record the source of changed inputs and identify the affected alternative. This governance prevents an outdated spreadsheet from silently shaping a current design choice. It also gives the owner a practical basis for reviewing future maintenance plans against the original assumptions.
For disciplined coordination between design decisions and project delivery, discuss project management with VULPIN Capital.
VULPIN Capital: The VULPIN Check
The VULPIN Check is a natural next step when a project team needs to assess a development decision beyond its initial budget. Life-cycle comparisons clarify long-term costs, while project viability also depends on execution, asset condition and the building’s purpose.
VULPIN Capital focuses on disciplined asset management and long-term, condition-driven real-asset development. Consider The VULPIN Check when evaluating whether a project aligns with those priorities. PCMNow Project Management supports delivery coordination, while FoxyHome provides sustainable housing solutions.
Bring the analysis into the wider project decision, with assumptions and trade-offs clearly understood. To discuss the next step, contact VULPIN Capital.
Carry the decision into the next project phase
A lifecycle cost analysis for construction projects is most useful when its assumptions remain part of the project record. That record can guide future approvals, operational planning and decisions to alter building systems. Keep the reasoning visible as responsibility passes from design to delivery and, eventually, facility operations.
For developers weighing the broader viability and execution of a real-asset project, VULPIN Capital offers The VULPIN Check, PCMNow Project Management and The Fox. These offerings are a relevant next step when a cost comparison needs to inform a wider project decision. The right path depends on the question the project team needs to resolve.
Bring the project’s decision into focus and consider how it fits your long-term asset priorities. Contact VULPIN Capital to discuss the next step. A disciplined decision today gives the project a clearer foundation for what comes next.
Frequently Asked Questions
What are the upfront, operating, maintenance, replacement, and end-of-life costs to include?
Include design, procurement, construction, energy, staffing, inspections, routine servicing, repairs, component replacement and disposal. Also account for disruption-related costs, such as temporarily relocating occupants during major work. For a roof comparison, include installation, inspection, repair, replacement and disposal. Separate recurring expenses from one-time costs, and record when each is expected to occur. This timing makes the cash-flow comparison more useful to project decision-makers.
How do you compare construction alternatives using net present value and discount rates?
Estimate each alternative’s costs by timing, then discount future cash flows to present value using one consistently applied rate. Compare the net present values over the same analysis period and scope. Keep inflation assumptions aligned with the rate: nominal cash flows require a nominal rate, while inflation-adjusted cash flows require a real rate. Test how rankings change when assumptions vary. This shows whether a decision depends heavily on one uncertain input.
How do lifecycle costs compare with initial construction costs for common materials and building systems?
No single relationship applies to every Canadian building or material. Lower-priced flooring, for example, may require more frequent repairs or replacement, while an HVAC system’s energy demand and service needs affect its ownership costs. Compare options under the same building use, analysis period and maintenance scope. Service life, operating conditions, replacement timing and required work all influence the result. The comparison should reflect the project’s actual specifications.
What Canadian standards, government guidelines, and procurement rules apply to lifecycle costing?
Use the project owner’s procurement documents, funding conditions and applicable jurisdictional requirements to establish the required method. Requirements can differ by owner and project, so don’t assume one procedure governs every Canadian construction project. ASTM International identifies standard E917- 02 as a procedure for analysing building life-cycle costs, and the National Institute of Standards and Technology’s Building Life Cycle Cost program includes Handbook 135 as a resource. Treat these as methodological references, not universal Canadian procurement rules.
How do energy prices, carbon costs, and building codes affect lifecycle cost analysis in Canada?
Energy-price assumptions affect projected operating costs, so model expected building use, fuel mix and applicable utility pricing. Include carbon costs only when they apply to the project’s operating or procurement assumptions, and document the basis. Treat applicable building-code requirements as design constraints. Compare alternatives that meet the same requirements, then test how changes in energy-price assumptions affect their relative costs. This separates code compliance from discretionary design choices.
What discount rates, inflation assumptions, and analysis periods are used for Canadian construction projects?
Use the discount rate and inflation treatment required by the owner’s evaluation framework, pairing nominal costs with a nominal rate or inflation-adjusted costs with a real rate. Set the analysis period to reflect the decision and relevant system life.